15 Common Problems that Hamper Reproducibility
15.1 Summary of Some Common Problems
We’ve now seen the issues stemming from crises of reproducibility across multiple academic fields. Before we can discuss potential solutions to the many problems, let’s take stock of some common problems that hamper reproducibility in Figure 15.1.
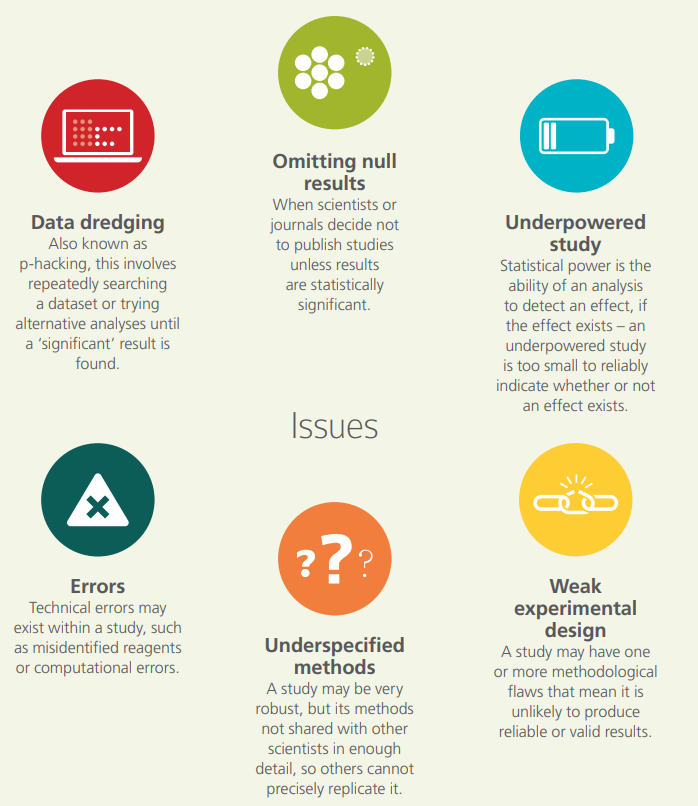
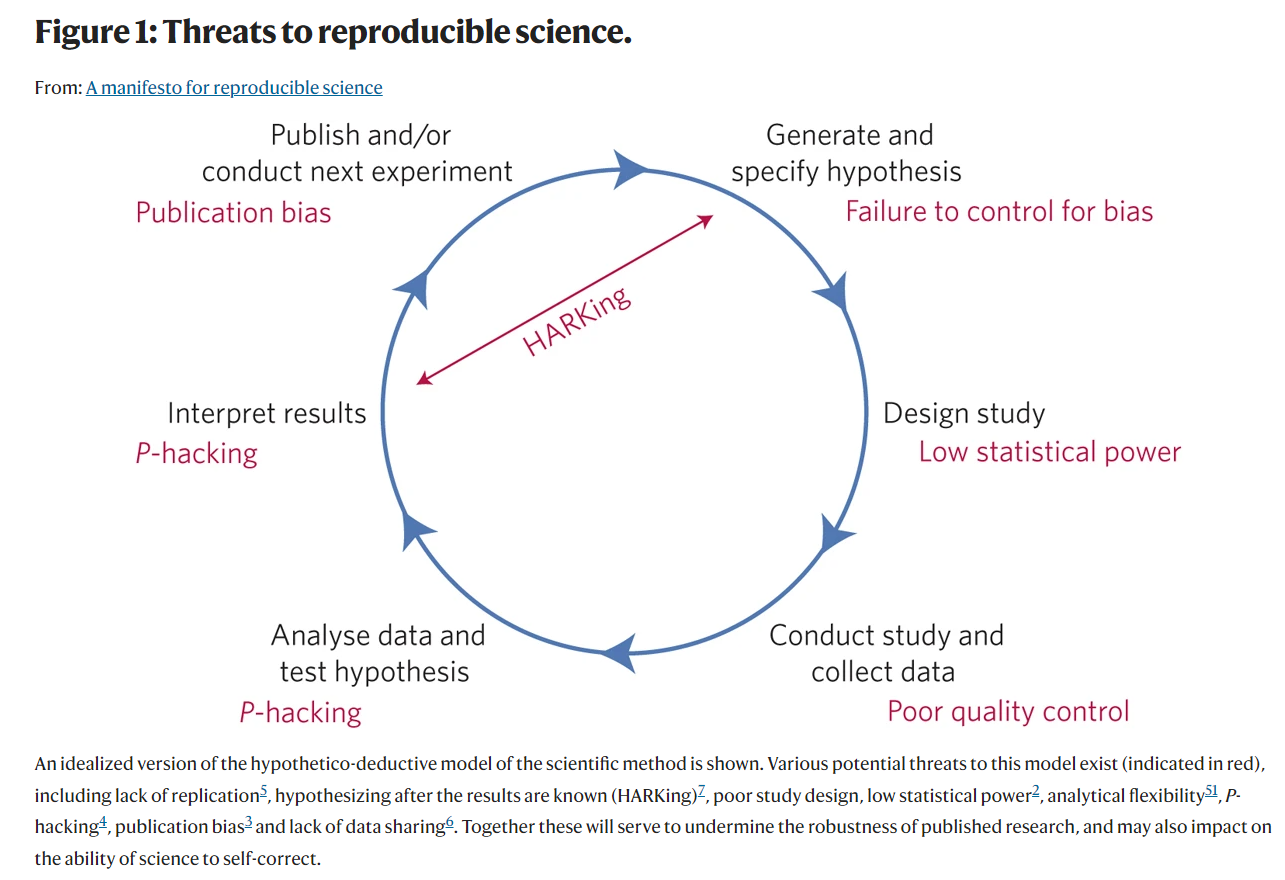
Notice how the issues are arranged in a circle. This is not a coincidence, as such researcher degrees of freedom are present at all steps in the research cycle. Consider the image in Figure 15.2, which comes from a 2017 paper in Nature.1
15.2 HARKing
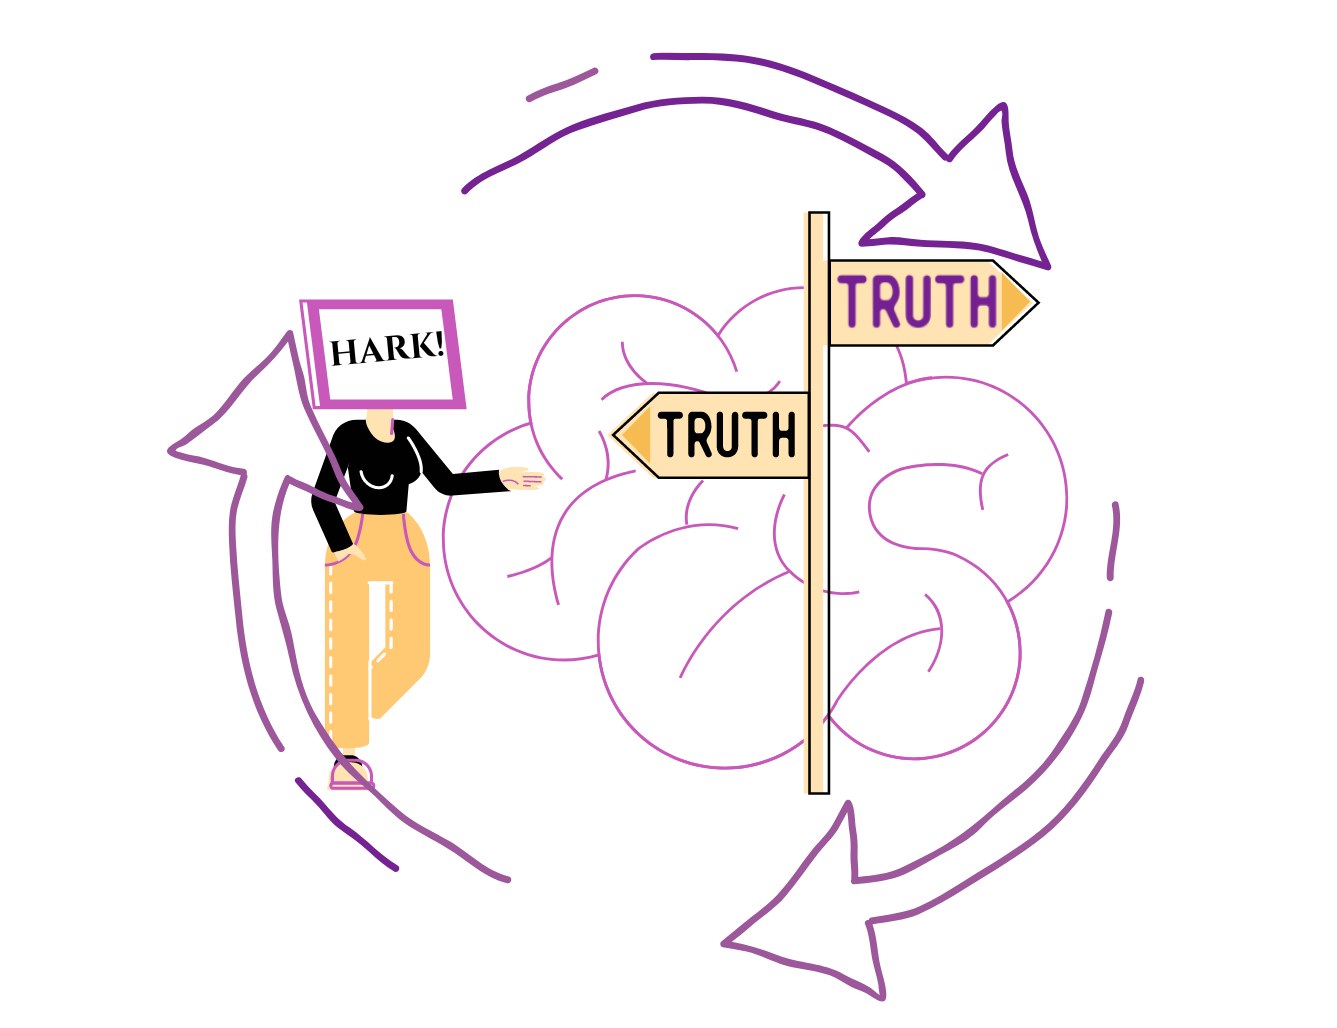
Besides illustrating the many possibilities for researcher degrees of freedom to introduce bias into the research process, Figure 15.2 it also points to the pernicious problem of HARKing (Hypothesizing After Results are Known),2 which is tantamount to circular reasoning. In practical terms, this process often looks like this:
The researcher conducts a hypothesis test based on a hunch H.
They don’t find what they expect, but find something statistically significant U.
The researcher writes up the results as H = Uusing the same data.
You may wonder, what’s the big deal? If you found something unexpected and interesting, isn’t that the point of science? To be clear, if the researcher starts with a hunch H and finds something unexpected and statistically significant U, it’s absolutely OK and even a good idea to explore U in a new study with different data. In fact, some suggest that this form of transparent HARKing (also known as THARKing) in which authors present new hypotheses derived from the data in the Discussion section of an article can be beneficial for knowledge creation.3 I agree with this position, as transparently stating your thoughts on potential new hypotheses can generate new ideas for future research, and also clearly bounds the discussion in an exploratory sense. But using the same data for H and U and pretending like H never existed is a problem.
For one, if hypotheses that are falsified are never reported, that distorts the evidence base for what hypotheses are supported and which hypotheses are not supported. Imagine 10 different researchers all investigate the same hypothesis H, and find that the hypothesis is not supported by the data, but don’t report it, then other researchers may continue to pursue H. This is a waste of resources. Instead, if all researchers reported that H is not supported by their data, this tells us that H might not be the right avenue to pursue.
Additionally, if the unexpected hypothesis U is reported as the a priori hypothesis, this reduces reproducibility as U may be unique to the sample, and not generalizable. It may represent a false positive or false negative. This is especially bad if the researcher is cherry-picking their results to support unexpected finding U because it is a straight-forward distortion of their findings. Reporting only statistically significant results and concealing non-significant results leads to a distortion in the evidence base and potentially wastes resources, as described above.
There are always chance variations in effect size due to sample size, the underlying odds in the effect being true before the study is even conducted, the composition of the sample, the variation in population effects, and more. Therefore, reporting U as H can be a case of a researcher being fooled by randomness, and reporting spurious effects as real ones.
It’s also worth noting that authors have since noting some variants of HARKing, which are shown in Table 15.1.4
| Acronym | Full Form | Description |
|---|---|---|
| CHARKing | Constructing Hypotheses After Results are Known | This is like the description of HARKing above. Creating hypotheses after the fact and presenting them as having been constructed a priori. |
| RHARKing | Retrieving Hypotheses After Results are Known | Let’s say the researchers had previously proposed some hypotheses but then dropped them. After the fact, they might revive those hypotheses and present them as having been known a priori. |
| SHARKing | Suppressing Hypotheses After Results are Known | Not reporting a priori hypotheses that were not supported by the results. This could also be not reporting a priori hypotheses supported by results just because the researchers didn’t like these hypotheses. |
A key problem of all variations of HARKing is that they can lead to theories that are overfit by the results.4 This means that the theories can become too bound up in the results of individual sample results, and thus are less useful at more general explanations of a phenomenon when applied to other samples and contexts.
15.3 Publication Bias & the File Drawer Problem

You may be wondering what motivates researcher degrees of freedom such as HARKing? One important consideration is the incentives that researchers have for engaging in researcher degrees of freedom. A key incentive is to be able to publish one’s results. In a perfect world perhaps, all results would have an equal opportunity to be published regardless of statistical significance. Unfortunately, this is not the case.
Studies with statistically significant results are more likely to be written up and published than studies with non-statistically significant results (i.e. null results as they are often called).5 67 8 Publication bias can be defined as An editorial predilection for publishing particular findings, e.g., positive results, which leads to the failure of authors to submit negative findings for publication.9 The editors of journals want to publish ground-breaking research so that the prestige, relevance, and citation frequency for their journal is increased. Sadly, null or negative results are not as attractive to publish than statistically significant results, despite being as important for providing a more complete picture of the evidence base for a given phenomenon. This can lead to substantial distortions of the evidence base.
Consider, for example, the findings of a 2021 meta-analytic study published in the prestigious journal Proceedings of the National Academy of Sciences which suggested that nudge interventions (light-touch behavioral interventions which sway an individual toward a particular choice without restricting their ability to make a different choice) have an average effect size of d= 0.43.10 This is a pretty large effect in the social science literature! It’s also a remarkable headline-worthy finding. However, even meta-analyses can be prone to publication bias, because any evidence syntheses is only as good as the evidence it synthesizes. Thus, when another research team applied a novel technique to account for publication bias, they found that the average effect size of nudge interventions dropped to about d = 0.04 - 0.11, which the authors concluded was suggestive of no evidence of such interventions.11 While the final word on nudge interventions is far from being written, this back-and-forth shows how the severity of publication bias can lead to drastically different estimates of overall effect.
Publication bias thus naturally leads researchers to suppress null or non-statistically significant findings. Many researchers don’t even write up their null result studies, and simply abandon them forever. This is known as the file drawer problem, where null results are relegated to a virtual or actual file drawer, never to see the light of day.12 The extreme case of the problem is that 5% of studies that have false positives (Type I errors) are published in journals, and 95% of studies with non-statistically significant results are relegated to the file drawer.12 However, consider that p-hacking increases the likelihood of false positives in the literature as well.
When examining the problem empirically based on studies supported by a National Science Foundation program, a group of authors found some troubling results,7 seen in Figure 15.3.
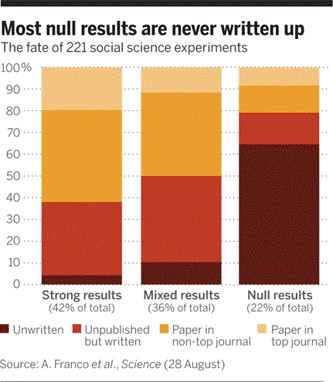
Publication bias is such an extensive problem (and having been recognized in the literature for over 40 years), that researchers are continually developing new methods to detect publication bias in evidence syntheses.13 1415 Of course, there are other potential solutions to the problem which we’ll discuss in the next chapter, but suffice it to say, we must always be cognizant of publication bias when evaluating a body of evidence.
15.4 Cognitive Biases
You might be thinking at this point, Why do researchers engage in researcher degrees of freedom if they know the consequences to the evidence base? That’s just the thing. They may willfully engage in unethical research practices, but they just as well be fooled by various cognitive biases to which we can all fall prey. For one, researchers have a strong incentive to publish papers, as their tenure and promotion is often heavily dependent on their publication output (hence the phrase Publish or Perish). Then given that journals are more likely to publish studies with statistically significant findings, researchers have a stake in the results of their quantitative research. Additionally, the salaries of researchers in many fields is also partly (and sometimes entirely) contingent on acquiring research funding, where a strong publication record is expected.
These conditions work synergistically with our inherent cognitive biases. For one, consider confirmation bias, or our tendency to look for evidence and conduct research in a way that aligns with our existing beliefs and hypotheses.16 In essence, confirmation bias pushes us to find what we want to find, rather than what is actually there. Though the term confirmation bias is relatively new, the phenomenon has been observed in research for quite some time. Consider this quote from 1869 by journalist Charles Mackay:
When men wish to construct or support a theory, how they torture facts into their service!17
We should be clear that confirmation bias need not be a conscious, malicious choice, but rather a subconscious motive which can affect even the most principled open scientists. A key consideration is that a research question differs from a hypothesis.18 The differences lies in how variables within a study are measured and the relationships between them postulated by hypotheses. Think of the research question as the big picture investigation of the phenomenon, and the hypotheses as being specific relationships of interest. If a researcher conducts a study and does not find evidence consistent with their hypothesis, a natural question would be if they constructed (or operationalized) their conceptual constructs in the right way. They may ask, Is this a problem with the implementation, measurement, or underlying theory? This is a valid question, and there are often no clear answers. However, there are solutions we will discuss in the next chapter that can mitigate biases such as this.
Similar to confirmation bias is hindsight bias, or the tendency to make a prediction after the fact (a postdiction) where a person thinks they knew it all along.19 For example, a researcher makes some vague prediction in their mind before conducting a study, conducts the study, and then selects one of many outcomes as something they predicted all along. This leads to overconfidence in the obtained results, and conflates prediction with postdiction.20 This can go hand-in-hand with HARKing, whereby the researcher creates hypotheses after obtaining results, and espouses the view that they knew this would happen all along.
Another important cognitive bias which influences reproducibility and research transparency is apophenia, or the human tendency to see patterns in randomness. A common example of this is seeing a face among a collection of inanimate objects, or seeing animal shapes in clouds. Consider the image in Figure 15.4.
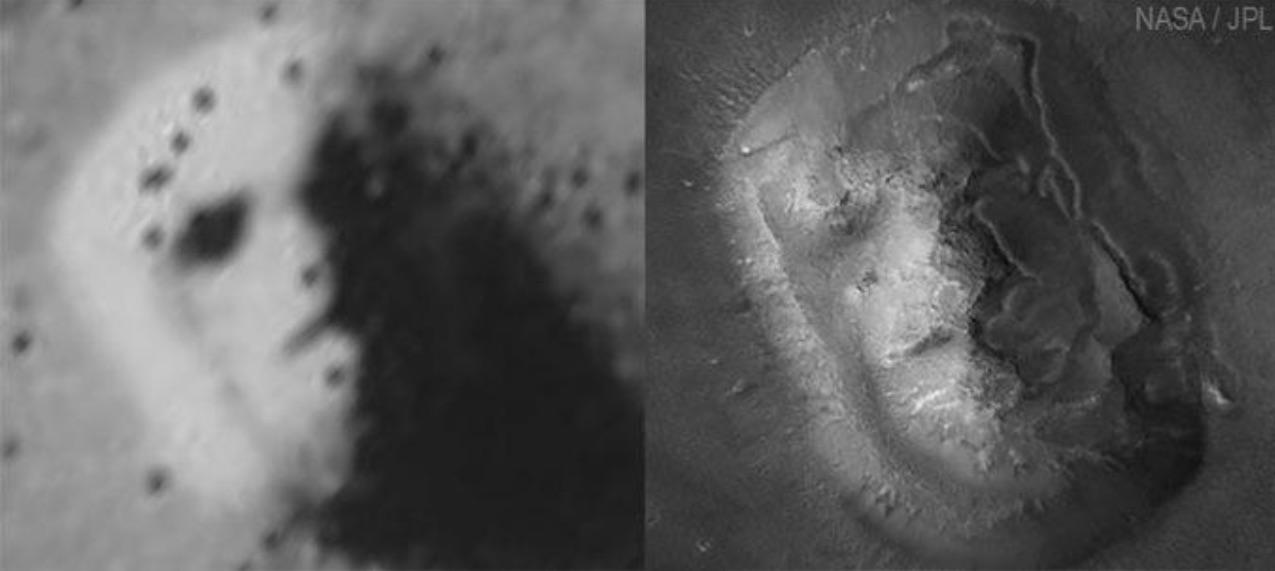
The image shows the same mesa on Mars - one captured in 1976 (on the left) and another captured in 2001 (on the right). The picture on the right has an image resolution 10 times higher than the image on the left. However, when NASA released the image on the left to the public in 1976, they thought the apparent ‘face,’ resembling an ancient Egyptian planet, would drum up public interest. What they didn’t realize is that it led to a lot of speculation about ancient civilizations on Mars, and conspiracy theories that NASA was hiding the facts.21 Even after the 2001 image was released, it didn’t satisfy everyone. Some still believed that this ‘face’ is evidence of a civilization on Mars. This reflects a natural tendency to see patterns where there are none.
When applied to research, apophenia can lead researchers to infer meaningful patterns based on noisy (or meaningless) data. For instance, running many hypothesis tests increases the likelihood of observing a false-positive, which researchers may perceive as a valid finding. Then, one or more cognitive biases can result in hypotheses and theories based on noise and spurious findings.
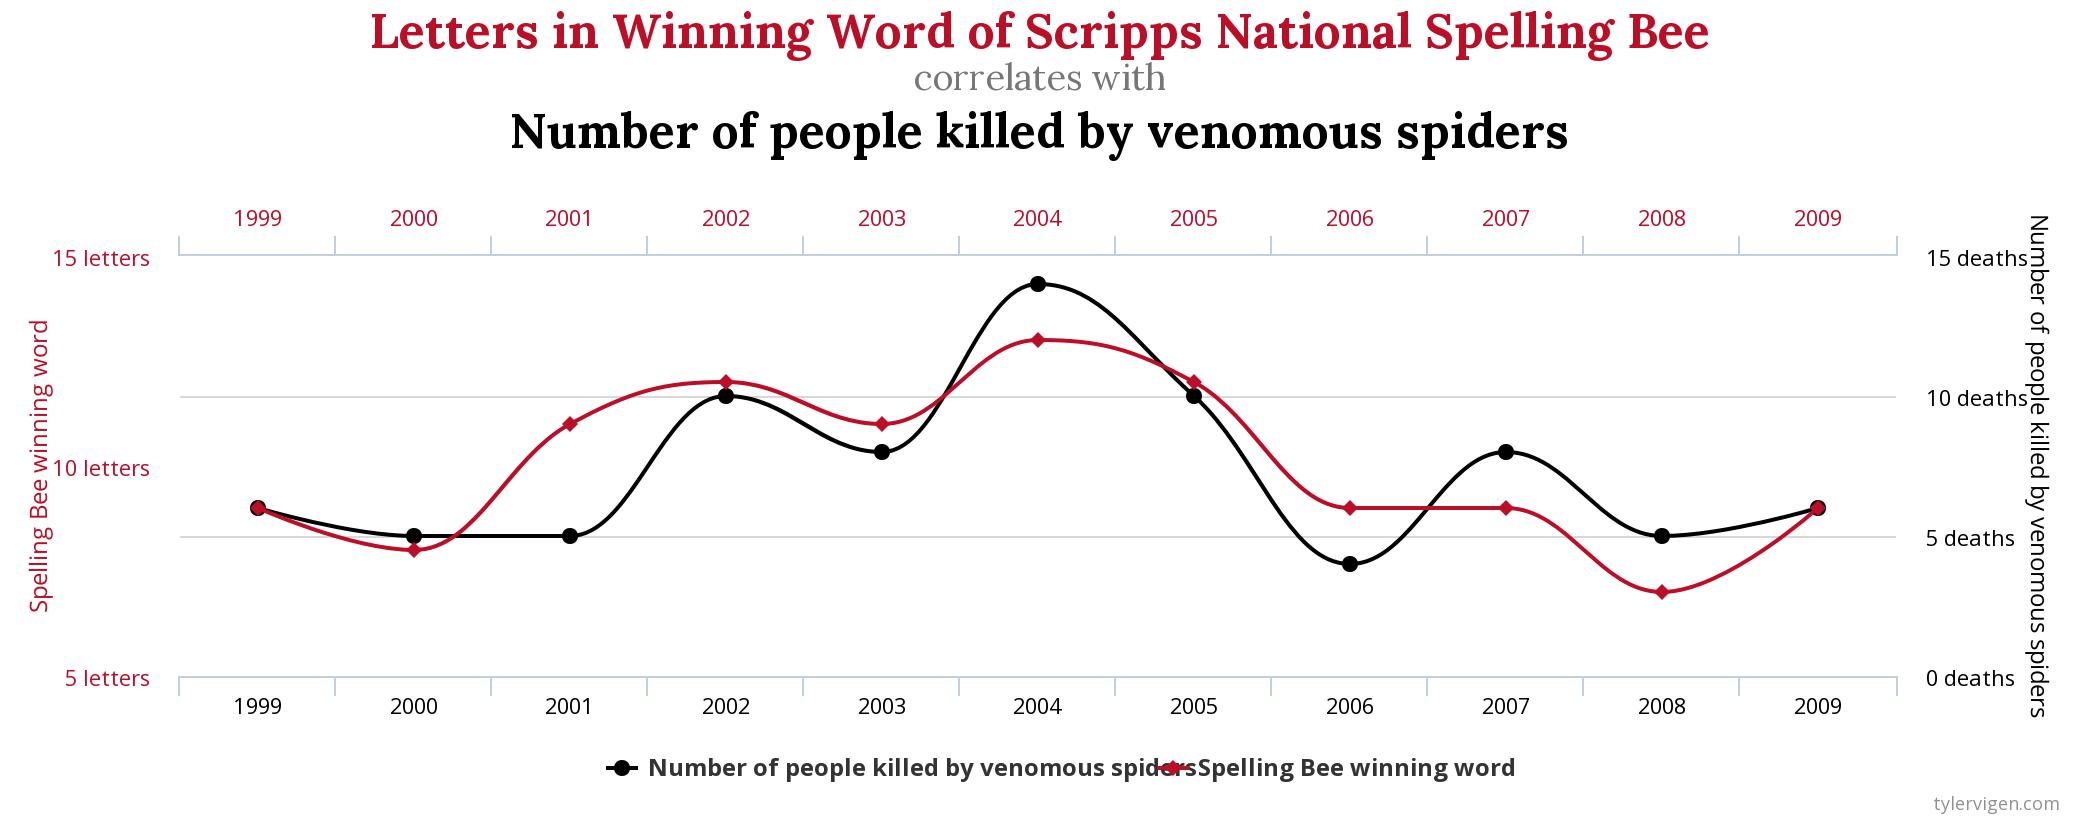
Have you ever heard the expression, Correlation does not necessarily equal causation? This is because just because two things are statistically related or similar does not mean that there is any meaningful relationship between them. However, our tendency toward apophenia can lead us to conclude a meaningful correlation when there isn’t one. Consider the image in Figure 15.5 from the website Spurious Correlations created by Tyler Vigen. The image shows a remarkably strong (and by chance) correlation between the number of letters in the winning word of the Scripps National Spelling Bee and the number of people killed by venomous spiders each year.
In sum, we should be mindful of the many cognitive biases that can shape our conduct of research. While the situation may seem hopeless, know that there is hope! In the next chapter, we’ll discuss many advances in Open Science that can help mitigate these biases in the conduct of research.